exuber
Helpers
Exuber scale and theme functions
Also: theme_exuber
scale_exuber_manual scale_exuber_manual(
color_values = c("red", "blue"),
linetype_values = c(2, 1),
linewidth_values = c(0.8, 0.7),
size_values = "DEPRECATED"
)
theme_exuber(
base_size = 11,
base_family = "",
base_line_size = base_size/22,
base_rect_size = base_size/22
)scale_exuber_manual sets the color, linewidth and linetype in the mappings of autoplot.radf_obj. theme_exuber is a complete theme that controls all non-data display.
Arguments
| color_values | a set of color values to map data values to. |
| linetype_values | a set of linetype values to map data values to. |
| linewidth_values | a set of linewidth values to map data values to. |
| size_values | [Deprecated] use linewidth_values. |
| base_size | base font size, given in pts. |
| base_family | base font family |
| base_line_size | base size for line elements |
| base_rect_size | base size for rect elements |
Value
A list of three ggplot2 scales (scale_exuber_manual) or a ggplot2 theme object (theme_exuber), which you add to a plot with +.
Examples
These examples are copied from the package's own documentation and are run by R CMD check on every release.
The printed output (after #>) and the plots were produced by running them against the current package source.
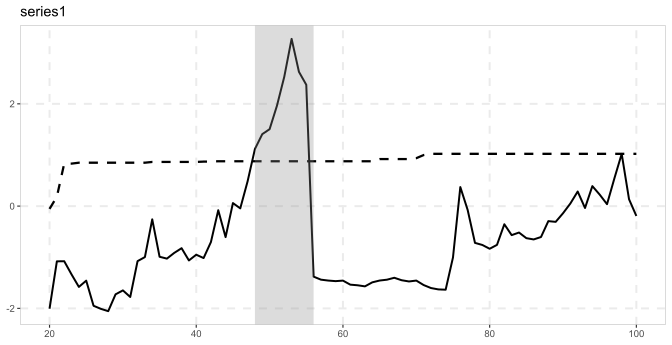
rsim <- radf(sim_psy1(100))
autoplot(rsim, cv = radf_mc_cv(100, nrep = 100)) +
  scale_exuber_manual(color_values = c("black", "black")) +
  theme_exuber(base_size = 9)
#> Scale for colour is already present.
#> Adding another scale for colour, which will replace the existing scale.
#> Scale for linewidth is already present.
#> Adding another scale for linewidth, which will replace the existing scale.
#> Scale for linetype is already present.
#> Adding another scale for linetype, which will replace the existing scale.