exuber
Analysis
Plotting a ds_radf object
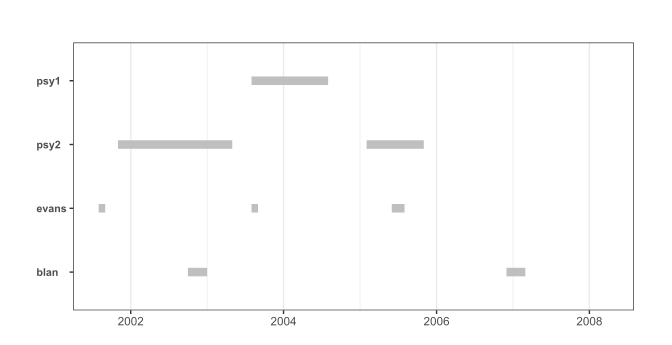
autoplot.ds_radf autoplot(object, trunc = TRUE, ...)Takes a ds_radf object and returns a ggplot2 object with a geom_segment layer.
Arguments
| object | An object of class ds_radf. The output of datestamp |
| trunc | Whether to remove the period of the minimum window from the plot (default = TRUE). |
| ... | Further arguments passed to methods. Not used. |
Value
ggplot
Examples
These examples are copied from the package's own documentation and are run by R CMD check on every release.
The printed output (after #>) and the plots were produced by running them against the current package source.
sim_data_wdate %>%
  radf() %>%
  datestamp() %>%
  autoplot()
#> Using `date` as index variable.
#> Using precomputed critical values for `cv`.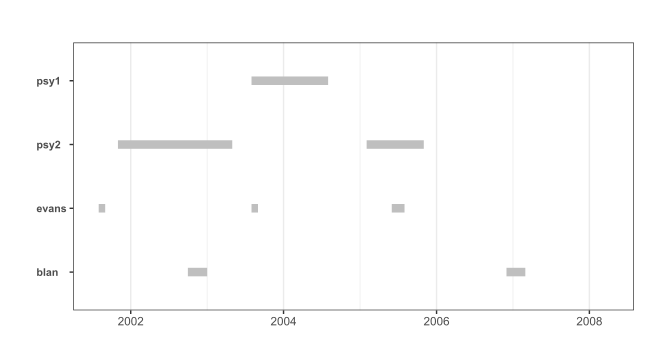
# Change the colour manually
sim_data_wdate %>%
  radf() %>%
  datestamp() %>%
  autoplot() +
  ggplot2::scale_colour_manual(values = rep("black", 4))
#> Using `date` as index variable.
#> Using precomputed critical values for `cv`.