exuber
Analysis
Tidy a ds_radf object
tidy.ds_radf tidy(x, ...)Summarizes information about ds_radf object.
Arguments
| x | An object of class ds_radf. |
| ... | Further arguments passed to methods. Not used. |
Examples
These examples are copied from the package's own documentation and are run by R CMD check on every release.
The printed output (after #>) and the plots were produced by running them against the current package source.
rsim_data <- radf(sim_data)
ds_data <- datestamp(rsim_data)
#> Using precomputed critical values for `cv`.

# One row per detected explosive episode, across all series
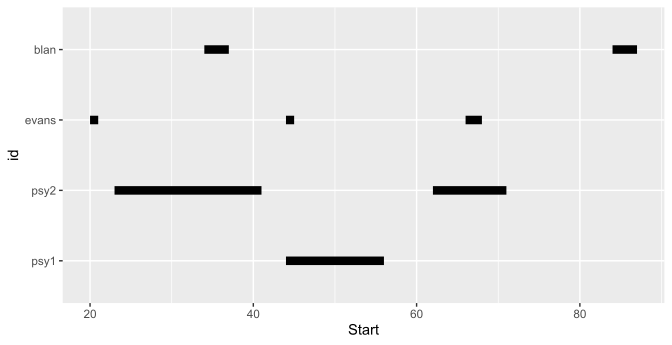
tidy(ds_data)
#> # A tibble: 8 × 7
#>   id    Start  Peak   End Duration Signal   Ongoing
#>   <fct> <dbl> <dbl> <dbl>    <dbl> <chr>    <lgl>
#> 1 psy1     44    48    56       12 positive FALSE
#> 2 psy2     23    40    41       18 positive FALSE
#> 3 psy2     62    70    71        9 positive FALSE
#> 4 evans    20    20    21        1 positive FALSE
#> 5 evans    44    44    45        1 positive FALSE
#> 6 evans    66    67    68        2 positive FALSE
#> 7 blan     34    36    37        3 positive FALSE
#> 8 blan     84    86    87        3 positive FALSE

# Pass the table to ggplot2 if the default layout of autoplot() does not suit you
library(ggplot2)
tidy(ds_data) %>%
  ggplot(aes(y = id)) +
  geom_segment(aes(x = Start, xend = End, yend = id), linewidth = 3)