 exuber
Volatility-robust (other routes)
CUSUM and CUSUM-of-Squares Bubble Tests (Kurozumi & Nishi 2025)
cusum_test
Replication record →
cusum_test(data, sig_lvl = 95, type = c("cs", "gcs", "cssq", "gcssq"))cusum_test implements the retrospective CUSUM ("cs"), generalized CUSUM ("gcs"), CUSUM-of-squares ("cssq") and generalized CUSUM-of-squares ("gcssq") tests of Kurozumi & Nishi (2025). These are the parameter-constancy statistics of Brown et al. (1975), applied to the first differences. The generalized versions take the supremum over every window start as well as every end point.
Arguments
| data | A univariate or multivariate numeric time series object, a numeric
vector or matrix, or a data.frame. A column may have leading or trailing
NA values, which describes an unbalanced panel in which series enter or
exit the sample at different times. Those periods are filled with NA in
badf and bsadf and excluded from the adf, sadf and
gsadf of that series. Interior NA values (a gap in the middle of
a series) are not supported. When any series is padded in this way, the panel
statistics (bsadf_panel and gsadf_panel) are not available, and
the function returns NA for them with a warning. |
| sig_lvl | Significance level on the 0 to 100 scale used throughout the
package, one of 90, 95 or 99. |
| type | One of "cs", "gcs", "cssq" or "gcssq". |
Value
An object of class cusum_test_obj: a list with the statistic path stat (one value for each end point, and for the generalized versions the sup over window starts), stat_inf (the inf path, for CSSQ and GCSSQ only), the statistic sup (and inf), the critical values crit and detected.
Details
CS and GCS reject when the cumulated increments become too large (right tail). CSSQ and GCSSQ are two-sided. They reject when the cumulated squared increments drift too far above or below their full-sample average, with half the level in each tail. The paper finds that the CUSUM-type tests lose almost all their power once the explosive coefficient is stochastic, while the CUSUM-SQ type keeps it. See ssu_test for the more powerful statistics of the paper.
Status
[Experimental]
Examples
These examples are copied from the package's own documentation and are run by R CMD check on every release.
The printed output (after #>) and the plots were produced by running them against the current package source.
y <- sim_psy1(n = 150, te = 75, tf = 150, c = 3, alpha = 1, seed = 2001,
  coef_noise = rnorm(149), coef_a = 4)
cusum_test(y, type = "cssq")
#>
#> ── cusum_test (CSSQ, n = 150, sig_lvl = 95%, crit = 1.32 / -1.34) ──────────────
#>
#>    series     sup     inf  detected
#>   series1  0.3095  -1.688      TRUE
autoplot(cusum_test(y, type = "gcssq"))
#> Warning: Removed 151 rows containing missing values or values outside the scale range
#> (`geom_line()`).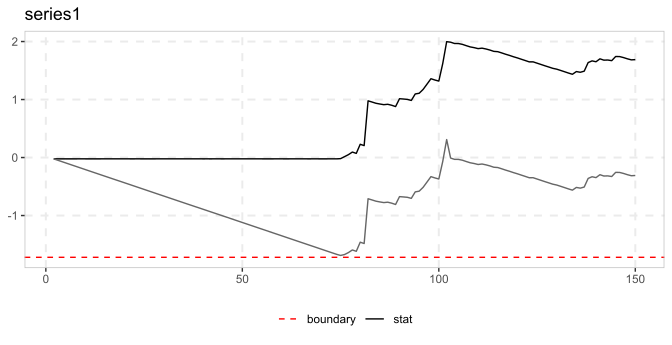
See also
ssu_test, and monitor_cusum for real-time CUSUM monitoring.
Other volatility-robust tests: radf_kp(), radf_sbz(), radf_sbz_union(), radf_sign(), radf_sign_dm(), radf_tt(), ssu_test()
References
Kurozumi, E., & Nishi, M. (2025). Bubble testing with stochastically varying explosive coefficient. Journal of Time Series Analysis, 46(5), 945-965.
Brown, R. L., Durbin, J., & Evans, J. M. (1975). Techniques for testing the constancy of regression relationships over time. Journal of the Royal Statistical Society B, 37(2), 149-192.