 exuber
Real-time monitoring
Real-Time Monitoring for Explosive Bubbles
monitor
Replication record →
monitor(
  data,
  r_star = 0.5,
  minw = NULL,
  nboot = 500L,
  sig_lvl = 95,
  lag = 0L,
  type = c("fixed", "aic", "bic"),
  seed = NULL,
  boundary = c("bootstrap", "kurozumi", "fluc"),
  s0 = 0
)
monitor implements real-time monitoring. You fix a training window [1, T*] that is assumed free of exuberance and calibrate a critical value on it. The function then compares the running recursive statistic at each subsequent point T*+1, ..., T with that fixed boundary and flags the first date at which the boundary is breached.
Arguments
| data | A univariate or multivariate numeric time series object, a numeric
vector or matrix, or a data.frame. A column may have leading or trailing
NA values, which describes an unbalanced panel in which series enter or
exit the sample at different times. Those periods are filled with NA in
badf and bsadf and excluded from the adf, sadf and
gsadf of that series. Interior NA values (a gap in the middle of
a series) are not supported. When any series is padded in this way, the panel
statistics (bsadf_panel and gsadf_panel) are not available, and
the function returns NA for them with a warning. |
| r_star | The end of the training window: a fraction in (0, 1) of the
sample (default 0.5), or an integer number of observations if
>= 1. |
| minw | A positive integer. The minimum window size (default = , where T denotes the sample size). |
| nboot | Number of wild bootstrap replications for the training critical
value. It is ignored unless boundary = "bootstrap". |
| sig_lvl | Significance level for the monitoring boundary on the 0 to 100
scale used throughout the package, one of 90, 95 (default) or
99. |
| lag | A non-negative integer. The lag length of the Augmented Dickey-Fuller regression (default = 0L). |
| type | Lag selection for the wild bootstrap process, passed to
radf_wb_ps_cv. It is ignored unless boundary = "bootstrap". |
| seed | Optional seed for the bootstrap draws. It is ignored unless
boundary = "bootstrap". |
| boundary | "bootstrap" (default, Phillips & Shi 2020),
"kurozumi" (the closed-form SADF/GSADF boundary of Kurozumi 2020) or
"fluc" (the FLUC boundary of Homm & Breitung 2012). |
| s0 | The range of window starts of Kurozumi (2020), as a fraction of the
training length. It is used only when boundary = "kurozumi". The default
0 is the SADF case, with the window start fixed at 1.
0.4 or 0.8 switches to the GSADF_{s0} case, where the window
start ranges over [1, floor(T* * s0)]. These are the only two values for
which the scaling constants of his boundary function are tabulated. |
Value
An object of class monitor_obj: a list with the full-sample statistic path (stat, which is bsadf for boundary = "bootstrap" and badf for "kurozumi" and "fluc"), the calibrated boundary (one flat value for each series), the length of the training window T_star, and alarm and alarm_date (the first observation or date in the monitoring period at which stat breaches the boundary, NA if it never does).
Details
boundary = "bootstrap" (the default) implements Phillips & Shi (2020). The boundary is a wild-bootstrap quantile of the GSADF-type statistic (see the tb parameter of radf_wb_ps_cv), and it is compared with the bsadf sequence of radf(). The function calibrates on the training window only (data[1:T*]) and not on the full series. The null-model fit inside radf_wb_ps_cv (adf_res()) uses all the data it is given and does not truncate them to tb, so passing data after T*, which may be explosive, directly to it would leak future information into the calibration of the null.
boundary = "kurozumi" implements the closed-form alternative of Kurozumi (2020). It needs no bootstrap and compares a published constant (his Table 1) with the badf sequence of radf(). The default s0 = 0 gives his SADF(k) detector, where the window start is fixed at 1. Setting s0 to 0.4 or 0.8 switches to his GSADF_{s0}(k) generalization. The window start then ranges over [1, floor(T* * s0)] and is not fixed at 1, and the comparison uses his boundary function, which varies with k and is not constant, together with its own published scaling constant. sig_lvl must be one of 90, 95 or 99, the levels that his table tabulates.
boundary = "fluc" implements the FLUC detector of Homm & Breitung (2012). Their DF_{t/n} is also exactly the badf sequence of radf(), and it is compared with a published constant from their Table 7 (the case without detrending) and not with a simulated one. sig_lvl must be one of 90, 95 or 99.
Status
[Experimental]
Examples
These examples are copied from the package's own documentation and are run by R CMD check on every release.
The printed output (after #>) and the plots were produced by running them against the current package source.
# A bubble-free training window (first half), explosive from t = 150 on
y <- sim_psy1(n = 200, te = 150, tf = 200, seed = 7)
# Default: Phillips & Shi (2020) wild bootstrap boundary
mon <- monitor(y, r_star = 0.5, nboot = 200)
print(mon)
#>
#> ── monitor (T* = 100 / 200, minw = 27, sig_lvl = 95%, boundary = bootstrap) ────
#>
#>    series  boundary  alarm  alarm_date
#>   series1     2.051    156         156
autoplot(mon)
#> Warning: Removed 2 rows containing missing values or values outside the scale range
#> (`geom_segment()`).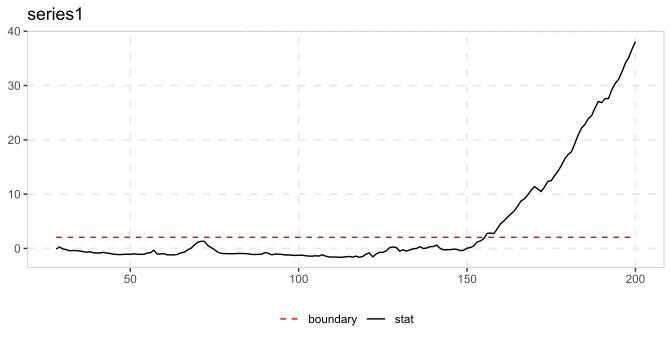
# Closed-form boundary of Kurozumi (2020), which needs no bootstrap
mon_kz <- monitor(y, r_star = 0.5, boundary = "kurozumi")
autoplot(mon_kz)
#> Warning: Removed 2 rows containing missing values or values outside the scale range
#> (`geom_segment()`).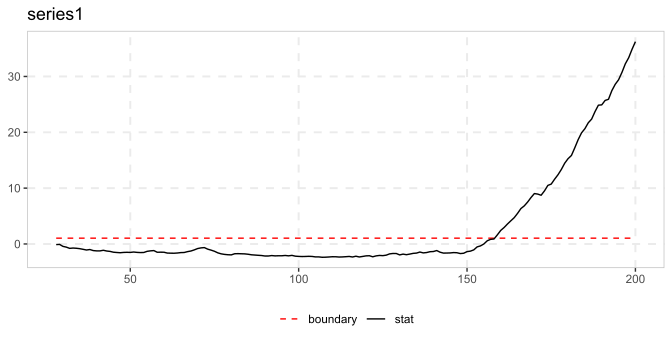
# Homm & Breitung (2012) FLUC boundary
autoplot(monitor(y, r_star = 0.5, boundary = "fluc"))
#> Warning: Removed 2 rows containing missing values or values outside the scale range
#> (`geom_segment()`).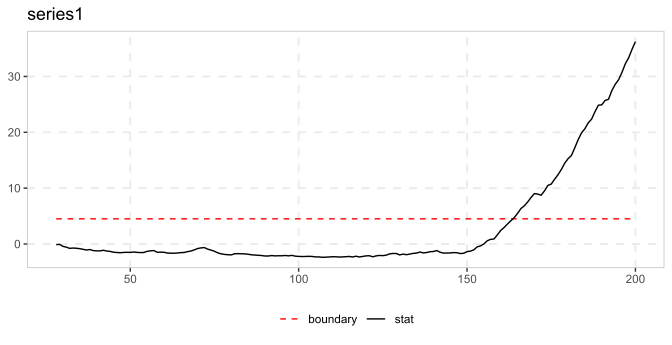
See also
radf_wb_ps_cv for the underlying wild bootstrap, and datestamp for the existing full-sample dating of origination and collapse, which is not a monitoring procedure.
Other monitoring: monitor_cusum(), monitor_lbi(), monitor_quantile()
References
Phillips, P. C., & Shi, S. (2020). Real time monitoring of asset markets: Bubbles and crises. In Handbook of Statistics (Vol. 42, pp. 61-80). Elsevier.
Kurozumi, E. (2020). Asymptotic properties of bubble monitoring tests. Econometric Reviews, 39(5), 510-538.
Homm, U., & Breitung, J. (2012). Testing for speculative bubbles in stock markets: A comparison of alternative methods. Journal of Financial Econometrics, 10(1), 198-231.