 exuber
Dating procedures
Reverse-Regression Dating of Crisis Origination and Market Recovery
radf_recovery
Replication record →
radf_recovery(
  data,
  minw = NULL,
  lag = 0,
  nrep = 1000L,
  sig_lvl = 95,
  seed = NULL
)
radf_recovery implements the reverse-regression dating of Phillips & Shi (2014). It reverses the series and runs the existing bsadf recursion of radf() on it. It then locates the first up-crossing of a critical-value boundary calibrated for the reversal, which is the market recovery date, and the next down-crossing, which is the crisis (collapse) origination date in the original series. Both are mapped back to the original time index.
Arguments
| data | A univariate or multivariate numeric time series object, a numeric
vector or matrix, or a data.frame. A column may have leading or trailing
NA values, which describes an unbalanced panel in which series enter or
exit the sample at different times. Those periods are filled with NA in
badf and bsadf and excluded from the adf, sadf and
gsadf of that series. Interior NA values (a gap in the middle of
a series) are not supported. When any series is padded in this way, the panel
statistics (bsadf_panel and gsadf_panel) are not available, and
the function returns NA for them with a warning. |
| minw | A positive integer. The minimum window size (default = , where T denotes the sample size). |
| lag | A non-negative integer. The lag length of the Augmented Dickey-Fuller regression (default = 0L). |
| nrep | Number of Monte Carlo replications for the critical value in
radf_recovery_cv. |
| sig_lvl | Significance level, one of 90, 95, 99. |
| seed | Optional seed for the Monte Carlo draws. |
Value
An object of class radf_recovery_obj: a list with f_c and f_r (the estimated dates, NA if not identified), detected (logical, whether an up-crossing was found at all) and censored (logical, whether f_c is left-censored by the start of the reverse-time sample).
Details
The function returns two dates for each series. f_c is the crisis origination (collapse-onset) date, a reverse-regression alternative to the collapse date that datestamp already dates from the forward test. f_r is the market recovery date, and f_c <= f_r always holds by construction, because the down-crossing is searched only after the up-crossing. If no up-crossing is found, neither date is identified (NA, detected = FALSE). If an up-crossing is found but no later down-crossing occurs before the reverse-time sample ends, f_c is NA and censored = TRUE, which means that the crisis origination predates the observed sample.
Caveats
[Experimental]
Validation status (2026-08-10). f_r (the recovery date) validates well against synthetic collapse-then-recovery data. Its bias is in the same range as in the Monte Carlo study of the paper, a few observations early. f_c (the crisis origination date) shows a materially larger residual bias in Monte Carlo checks. The empirical false-detection rate under a pure random-walk null (n = 100, minw = 20, 95\% level) is around 29\%, which is higher than the comparable numbers for the forward tests elsewhere in this package. We found and fixed one artifact of the synthetic process during validation, where a level jump at a regime boundary produced a spurious spike. The remaining bias in f_c and the elevated false-detection rate are not fully explained. They may be genuine finite-sample noise from the literal first-down-crossing rule of the paper. The inf in its eq. 9 has no persistence requirement, so a transient dip below the boundary is enough to trigger a premature f_c. We have not ruled out a subtler implementation issue. Treat f_c and the overall detection rate as exploratory until they are validated further, and see docs/dating-and-root-inference.md for the full numbers. The function emits the same short pointer as a message when it is called (use suppressMessages to silence it) and stores it as attr(x, "caveat") on the returned object.
Examples
These examples are copied from the package's own documentation and are run by R CMD check on every release.
The printed output (after #>) and the plots were produced by running them against the current package source.
# The expansion, bubble, collapse and recovery process of sim_ps1()
y <- sim_ps1(n = 100, seed = 1)
res <- radf_recovery(y, minw = 15, nrep = 200, seed = 1)
#> Experimental. f_c and the overall false-detection rate are exploratory pending further validation; see ?radf_recovery, Caveats section.
print(res)
#>
#> ── radf_recovery (n = 100, minw = 15, level = 95%) ─────────────────────────────
#>
#> ℹ Experimental. f_c and the overall false-detection rate are exploratory pending further validation; see ?radf_recovery, Caveats section.
#>
#>    series  f_c  f_r  detected  censored
#>   series1   57   67      TRUE     FALSE

# Plot the series with the estimated collapse (f_c) and recovery (f_r) points
autoplot(res)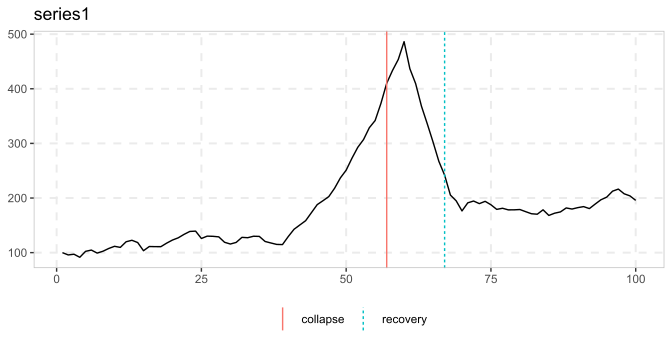
See also
datestamp for the forward, non-reversed dating of origination and collapse that this function complements.
Other dating: dating_hls(), dating_hlw(), dating_knp(), dating_pdc(), rootstamp()
References
Phillips, P. C. B., & Shi, S. (2014). Financial Bubble Implosion and Reverse Regression. Cowles Foundation Discussion Paper No. 1967, Yale University. Published in Econometric Theory.