 exuber
Simulation
Simulation of an Evans (1991) bubble process
sim_evans sim_evans(
n,
alpha = 1,
delta = 0.5,
tau = 0.05,
pi = 0.7,
r = 0.05,
b1 = delta,
seed = NULL
)Simulation of an Evans (1991) rational periodically collapsing bubble process.
Arguments
| n | A positive integer specifying the length of the simulated output series. |
| alpha | A positive scalar, with restrictions (see details). |
| delta | A positive scalar, with restrictions (see details). |
| tau | The standard deviation of the innovations. |
| pi | A positive value in (0, 1) which governs the probability of the bubble continuing to grow. |
| r | A positive scalar that determines the growth rate of the bubble process. |
| b1 | A positive scalar, the initial value of the series. Defaults to delta. |
| seed | An object specifying if and how the random number generator (rng)
should be initialized. It is either NULL or an integer, which is passed to
set.seed before the simulation. If you set it, the value is saved as the
"seed" attribute of the returned value. The default, NULL, leaves the state of
the rng unchanged and returns .Random.seed as the "seed" attribute. Results are
reproducible across the parallel and the non-parallel option when you use the
same seed. |
Value
A numeric vector of length n.
Details
delta and alpha are positive parameters which satisfy . delta represents the size of the bubble after collapse. The default value of r is 0.05. The function checks whether alpha and delta satisfy this condition and will return an error if not.
The Evans bubble has two regimes. If the bubble grows at an average rate of :
When the bubble expands at the increased rate of :
where is a binary variable that takes the value 0 with probability and 1 with probability . In the second phase, there is a () probability of the bubble process collapsing to delta. By modifying the values of delta, alpha and pi the user can change the frequency at which bubbles appear, the mean duration of a bubble before collapse and the scale of the bubble.
Examples
These examples are copied from the package's own documentation and are run by R CMD check on every release.
The printed output (after #>) and the plots were produced by running them against the current package source.
sim_evans(100, seed = 123) %>%
  autoplot()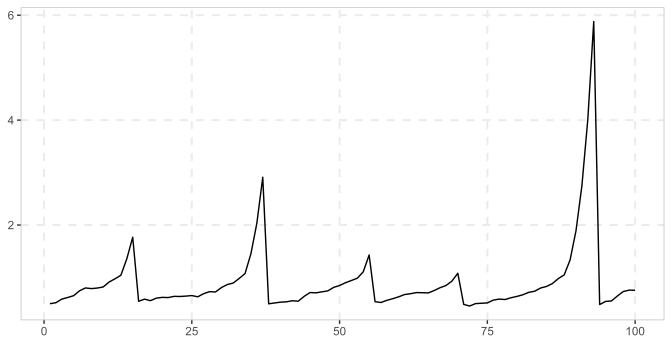
See also
References
Evans, G. W. (1991). Pitfalls in testing for explosive bubbles in asset prices. The American Economic Review, 81(4), 922-930.